
What Is EDR? How Endpoint Detection, Investigation, and Response Work
A practical explanation of how EDR connects endpoint telemetry into alerts, investigations, and controlled response actions.
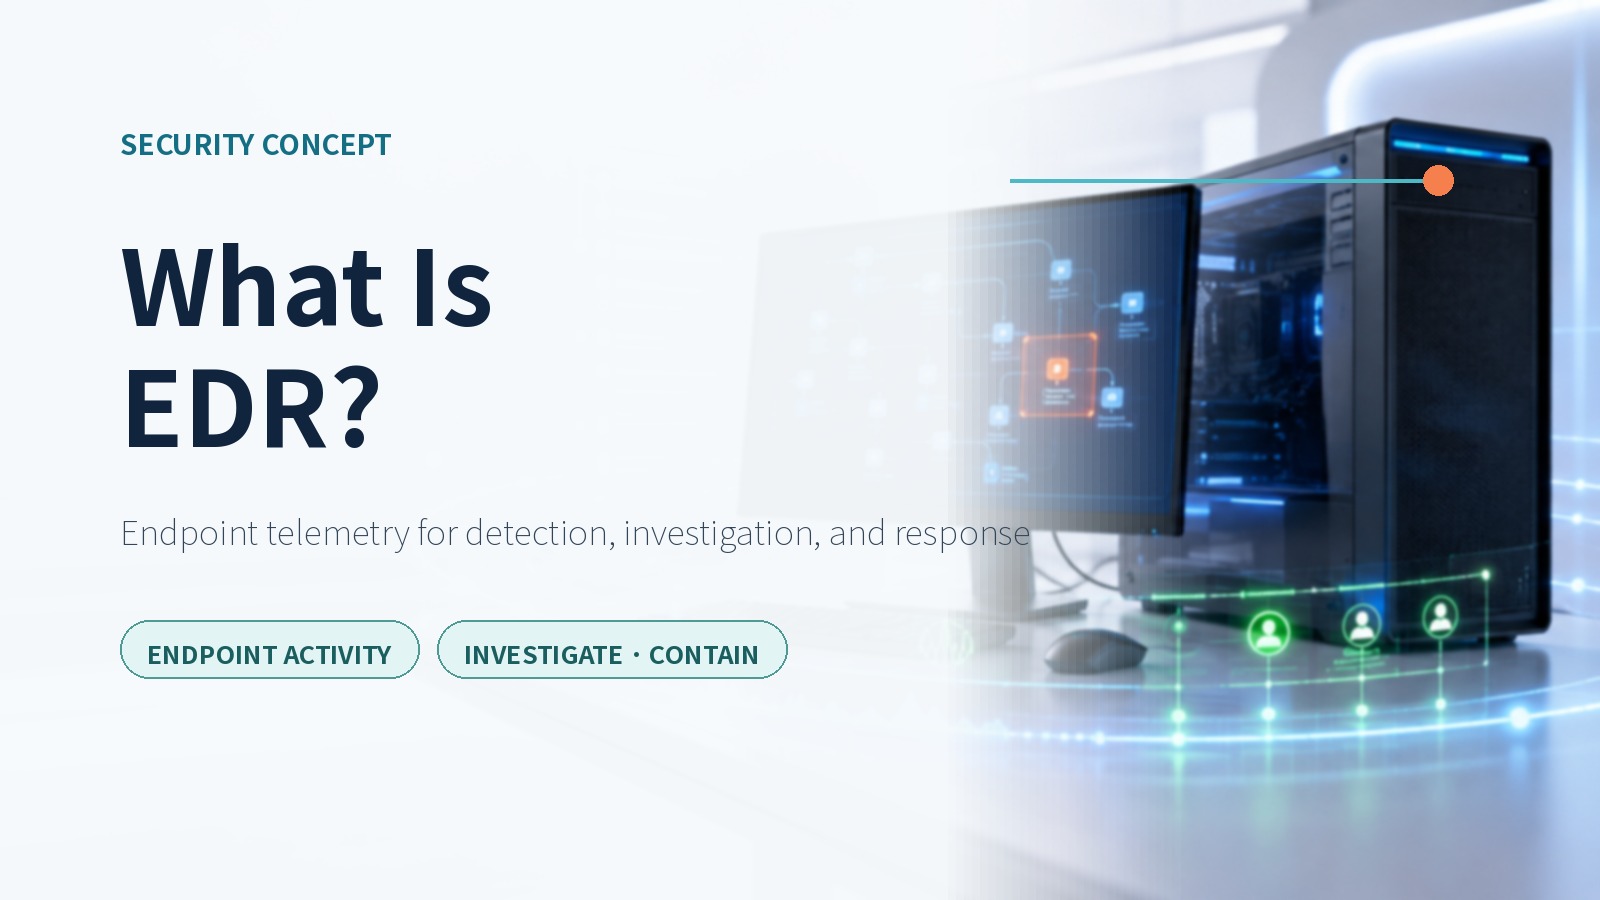
Investigation Starts at One Endpoint
Imagine a workstation where an unfamiliar command interpreter starts, followed by a burst of document access and an outbound connection. Each record may look ordinary in isolation. The picture changes when the parent process, user session, file activity, and network connection are assembled into one timeline.
Endpoint detection and response, or EDR, is the security technology that collects activity from PCs and servers, detects suspicious behavior, supports investigation, and enables response actions on affected endpoints.
The Role of EDR
EDR is not limited to matching a malicious filename. Its value comes from connecting endpoint activities so an analyst can understand what happened, what preceded the alert, and what followed it. A process tree that links a document application to a command interpreter and then to an external connection can be more useful than a single file reputation result.
NIST uses EDR as the acronym for endpoint detection and response. Implementations vary by vendor and license, but the common scope includes collecting endpoint telemetry, detecting suspicious behavior, organizing alerts and incidents, supporting investigation, and taking response actions.
Endpoint Telemetry
An EDR sensor observes operating-system activity such as process creation, executable paths, command lines, file changes, user sign-ins, registry or configuration changes, and network connections initiated by the endpoint. Products do not necessarily preserve every event at the same level; collection depends on policy, sensor design, and service limits.
The distinction between an event and a behavior chain matters. One event records a fact at a moment in time. A behavior chain links the document a user opened, the child process it created, the payload written to disk, and the persistence change that followed.
Microsoft describes continuous collection of behavioral telemetry including processes, network activity, sign-ins, registry changes, and file-system activity. It also states that endpoint detection is not intended to be a complete audit log of every operation. A quiet console therefore does not prove that every endpoint activity was benign.
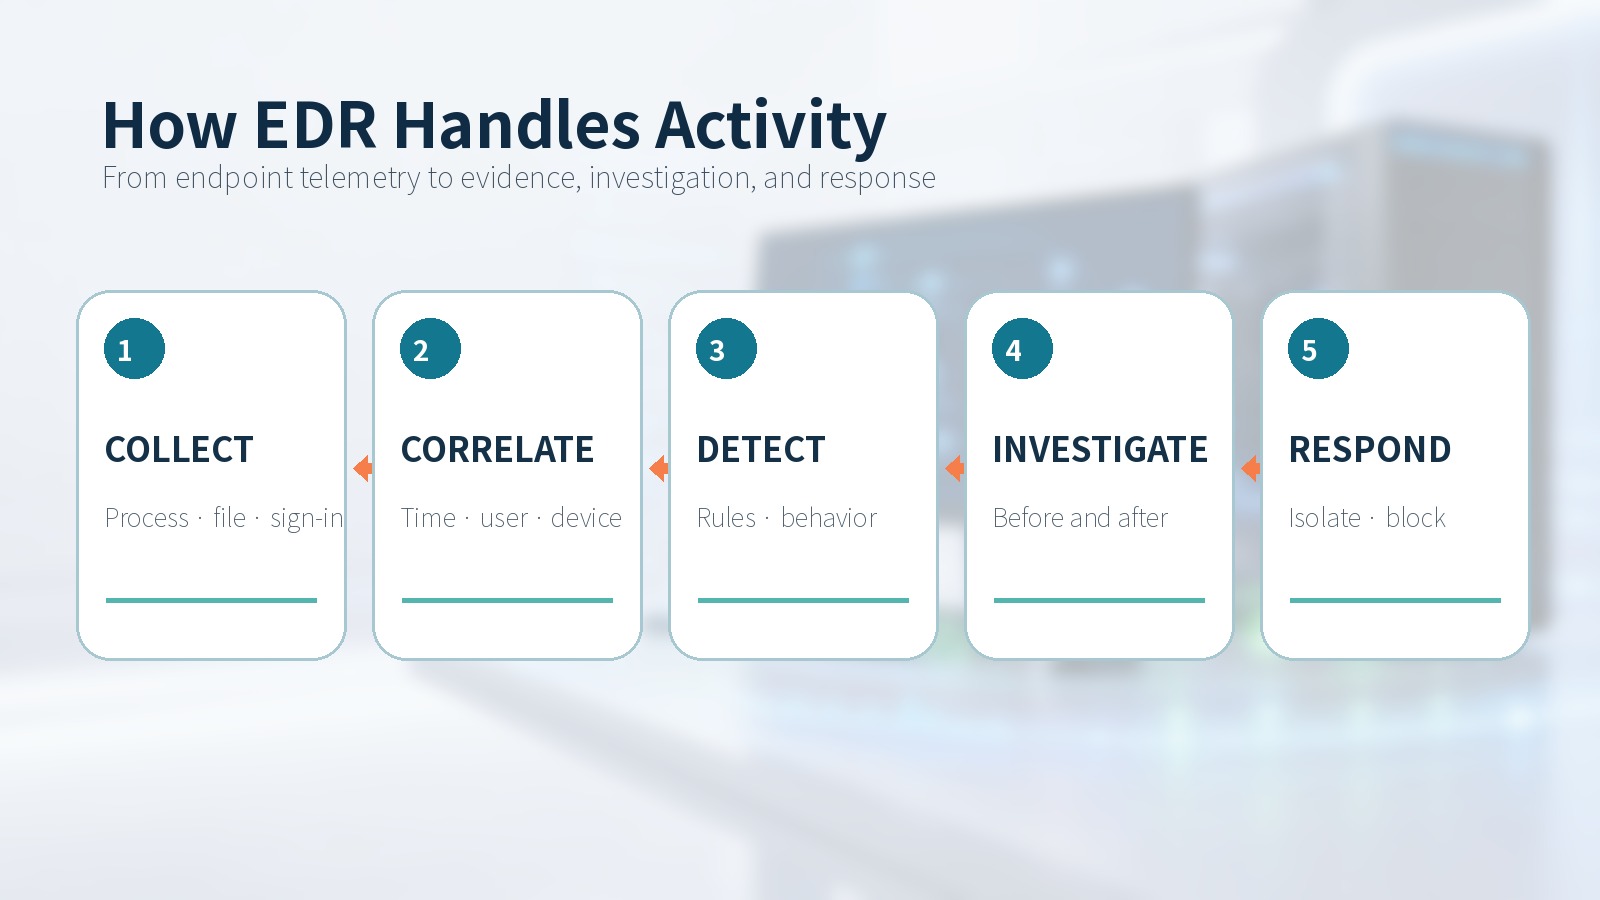
From Detection to Alert
Collected activity may be evaluated with rules, indicators, behavioral analytics, and statistical baselines. Some alerts come from one strong condition; others combine several weaker signals. Detection names and coverage differ across products, so identical behavior will not always produce identical alerts.
A useful alert includes evidence: the process tree, user, device, time, file path, destination, and related events. Analysts should begin with the behavior that created the alert rather than stopping at the alert name or severity.
Investigation Flow
Investigation starts before the alert time. Analysts identify the original execution source, determine whether a user or another process launched it, and look for the same file, command, or destination on other managed endpoints. They then examine the activity that followed, including file changes, credential access attempts, remote connections, and outbound traffic.
Time and context are essential. An old download may be related to a process that runs today, while simultaneous events in different user sessions may be unrelated. EDR presents relationships, but the final judgment must combine collection scope with the endpoint’s business role.
Coverage also depends on sensor health. Endpoints without an installed agent, devices that have stopped reporting, and unsupported systems cannot be investigated with the same visibility. Asset inventory and sensor status directly affect the reliability of an EDR investigation.
Response Actions
Response turns detection into containment. Common actions include network isolation, stopping and quarantining a suspicious file, blocking an indicator, and collecting investigation packages. Microsoft lists manual actions such as running a scan, isolating a device, stopping and quarantining a file, and adding a block or allow indicator.
Actions can affect business services. Isolating a server may reduce attacker movement but also interrupt a production application. Blocking a shared file can disrupt many endpoints. Organizations should define response authority, approval paths, emergency isolation criteria, and release conditions before an incident.
Architecture and Coverage
A typical EDR design includes a sensor on each managed endpoint and a central management service. Sensors observe activity and enforce policy. The central service stores and analyzes telemetry, presents alerts and incidents, and often sends response commands back to sensors. Cloud-hosted and self-managed designs use different communication and storage paths.
Coverage should be deliberate. User workstations, production servers, roaming laptops, and virtual desktops have different operating conditions. Supported operating systems, resource impact, proxy paths, certificates, update methods, and offline behavior all need validation before rollout.
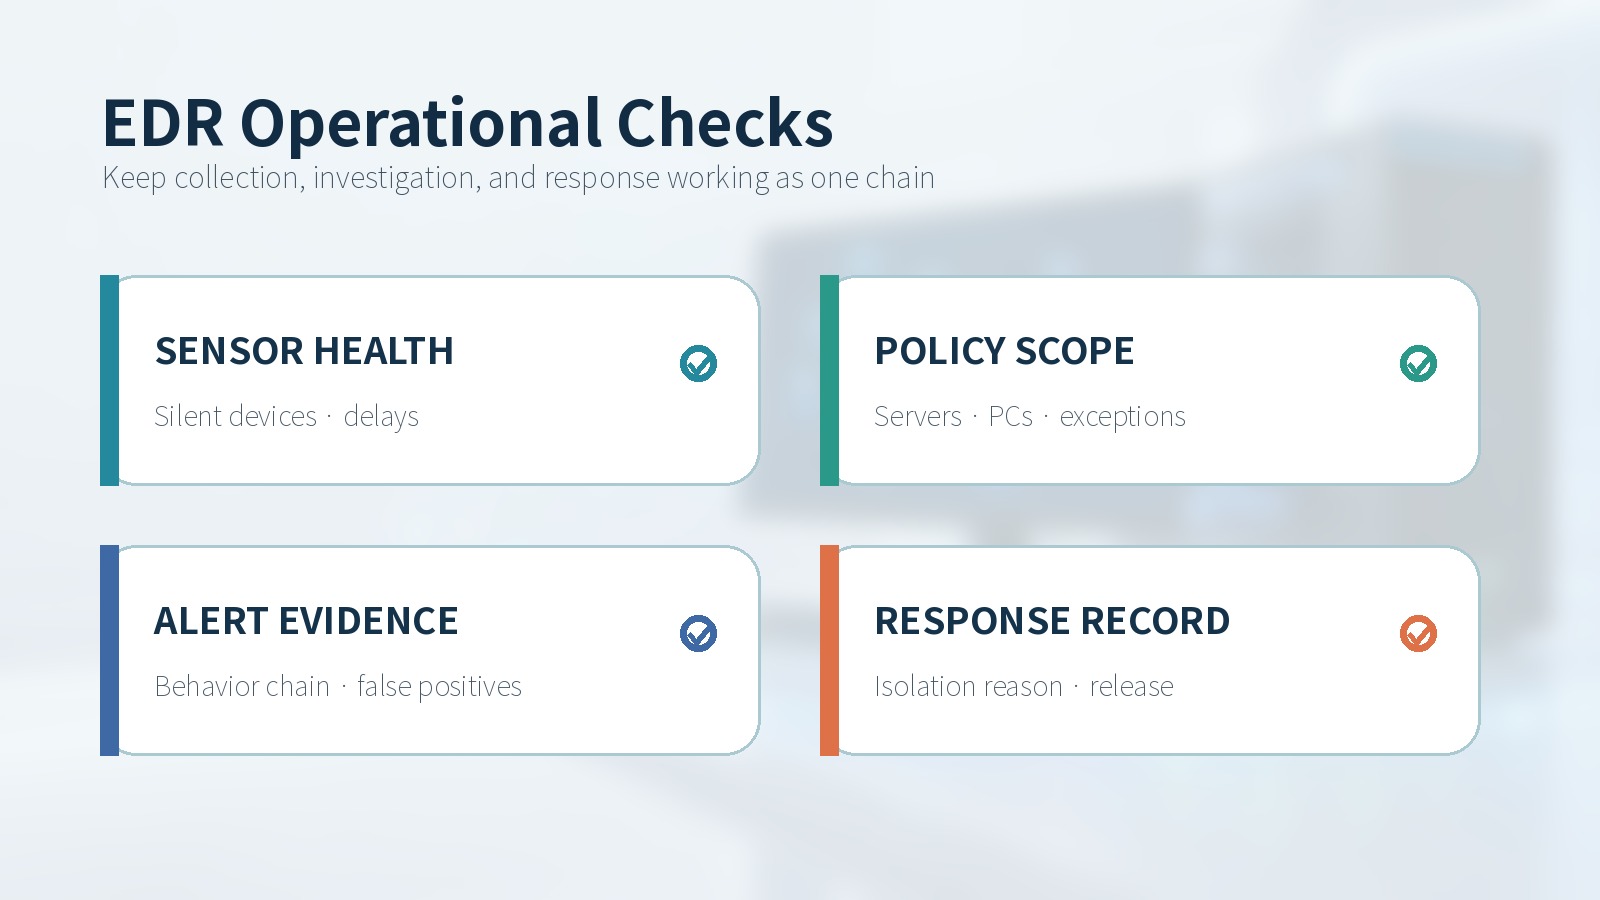
Operational Checks
Start with sensor health: last report time, policy status, version, and long-offline devices. Reconcile the EDR inventory with the authoritative asset list so unmanaged systems and retired records do not distort investigation scope.
Review policy scope next. Servers and user workstations have different business activity. Development tools, operations scripts, and remote-management utilities may legitimately use powerful functions. Every exception should record its target, justification, owner, approval, and expiration date.
Measure alert quality rather than simply suppressing repeated noise. Record the conditions that create false positives, the evidence needed to distinguish normal activity, and the detection coverage lost when an exception is added. Prioritization should combine alert severity with asset value, user privilege, related behavior, and external communication.
Keep response records. Document who isolated a device, the evidence used, service impact, and the conditions for release. Even a false positive can improve future handling when the investigation rationale and resulting policy changes are preserved.
Limits of EDR
EDR focuses on activity visible to its endpoint sensor. Unmanaged devices, broken collection, unsupported operating systems, and events outside policy do not receive the same visibility. Attackers may also use legitimate tools and credentials, making context and behavior correlation essential.
An alert is a starting point for judgment, not a guaranteed verdict. Effective EDR operation joins sensor coverage, asset reconciliation, evidence-based triage, controlled response, and post-incident review into one lifecycle.
Summary
EDR collects and connects activity from PCs and servers, detects suspicious behavior, supports investigation, and enables response on affected endpoints. Its operational value depends on healthy sensors, controlled exceptions, evidence-rich alerts, and documented containment and release decisions.
Sources reviewed
- Endpoint Detection and Response - CSRC GlossaryNIST · Official source
- 엔드포인트 검색 및 대응 개요Microsoft · Official source
- Understanding and Mitigating Russian State-Sponsored Cyber Threats to U.S. Critical InfrastructureCISA · Official source
SECUFOCUS NOW reorganized and analyzed the material above. This article does not replace the original sources.
Related SecuNote articles

What Is a VPN? Encrypted Tunnels, Traffic Flow, and Connection Scope
A VPN creates a protected communication path over a shared network to connect remote devices or separate private networks. This…

What Is NAC? How Network Admission and Access Decisions Work
Network access control evaluates who and what is connecting, where the request originates, and whether the endpoint meets policy…
What Is NDR? How Network Detection and Response Analyzes Traffic
A practical explanation of how NDR analyzes north-south and east-west traffic, connects assets and sessions, and turns network…
Comments
No comments yet.